Network Detection & Response
Designing an interactive investigation view for complex cyber attacks.
Role
Lead Product Designer
Timeline
Jan 2022 - July 2022
Platform
VMware NSX
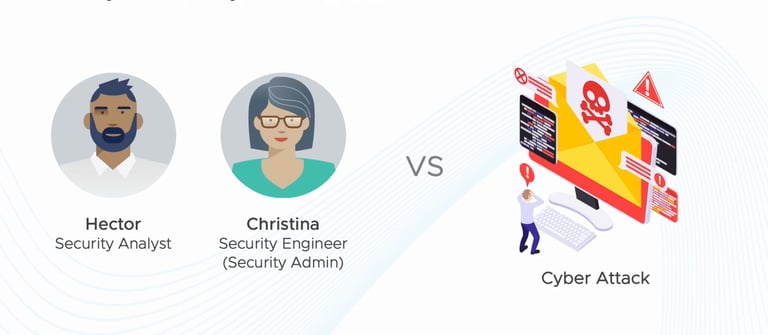
Network Detection & Response (NDR) is an enterprise cybersecurity product used by analysts to investigate and mitigate network threats.
From a standalone product to an integrated feature within the existing VMware NSX, I led the complete design of a new interactive campaign visualization that unified threats, workloads, and attack stages into a single investigation experience — reducing friction and accelerating decision-making in high-stakes environments.
Introduction
Reframing NDR from fragmented dashboards to a relational Investigative View
When investigation time determines damage, clarity becomes critical.
In cybersecurity, delays compound risk. Once an attacker enters a system, they move laterally — triggering chains of activity across workloads. Analysts must quickly understand what happened, where it spread, and what to prioritize next.
The goal of the Network Detection & Response product is to support rapid pattern recognition at scale.
Designing for High Speed In High Stakes Environments

The existing NDR Defender experience relied on dashboard cards that led to separate pages for Threats, Hosts, and Detection details. Each view contained valuable data, but analysts had to navigate between them to reconstruct an attack chain manually.
The existing system had the data of every attack; however, it wasn't telling the story holistically.
The Challenge
The Design Objective
How can we tell a clear story of complex cyberattacks so users can respond and defend faster than they do now?
Our goal was not to add another dashboard. It was to remove the need for navigation altogether.
After rounds of discussions with the backend and frontend teams, I understood the ins and outs of detection and campaigns. We set out to consolidate essential information into a single surface — making the relationship among threats, workloads, and attack stages immediately visible.
Our users, SOC analysts, should be able to scan, prioritize, and investigate without losing context.
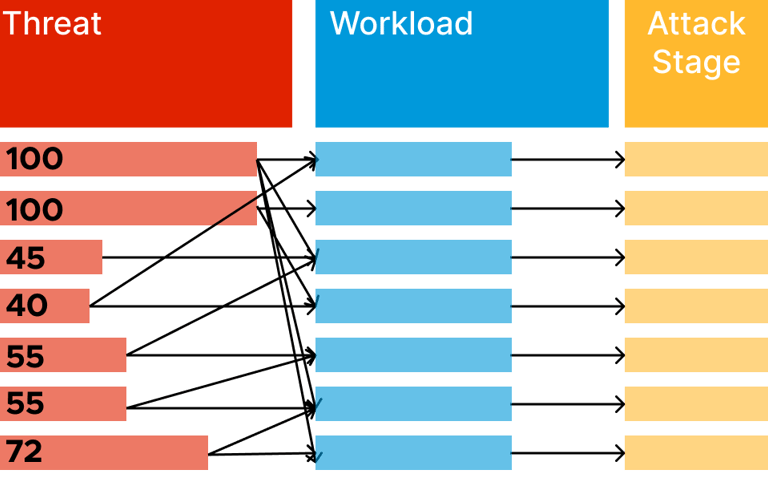
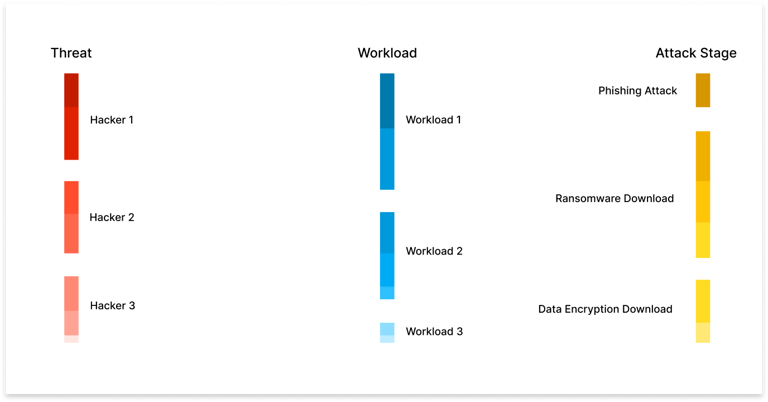
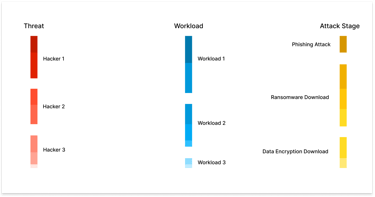
Every detection fundamentally connects three elements:
a threat, an affected workload, and a stage in the attack chain.
Instead of distributing these across multiple views, we reorganized the experience around their relationships. The visualization became the surface for the investigation — mapping how entities connect, rather than where they live in the UI.
This reframing aligned the product with how analysts actually think.
Shift from navigation to synthesis
Design for Relationships, Not Pages

One Surface. Multiple Signals.
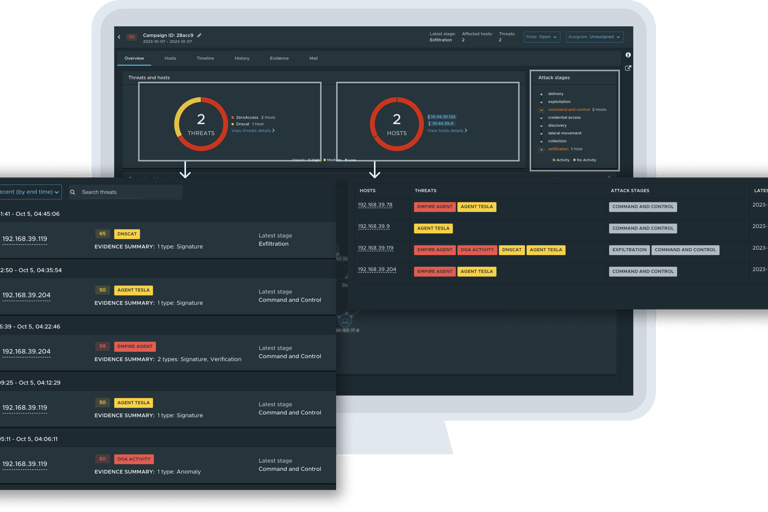
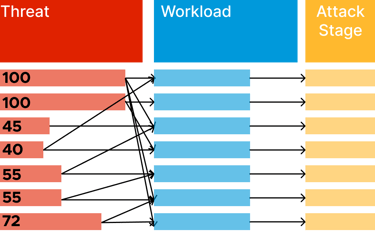
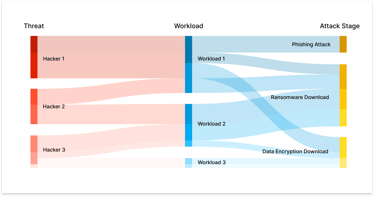
The final system unified threats, workloads, and stages into a single interactive visualization. Each detection appeared as a relationship — not an isolated alert.
Analysts could immediately see which threats affected which workloads, and how attacks progressed across stages. Critical nodes surfaced through visual hierarchy, allowing fast comparison and prioritization.
Before, analysts stitched context together mentally.
Now, the system does the work for them.
Unify threats, workloads, and attack stages in a single visual model.
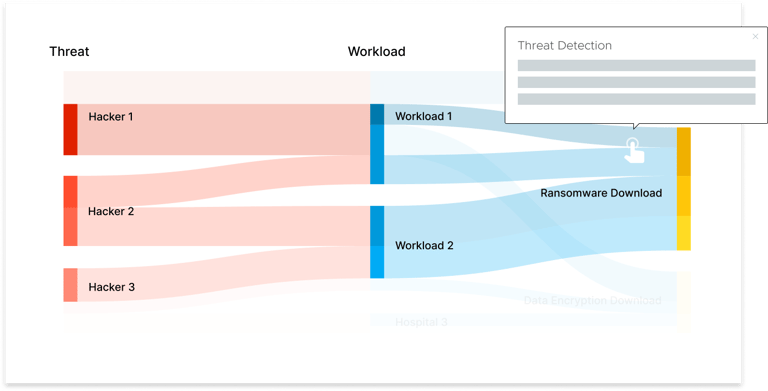
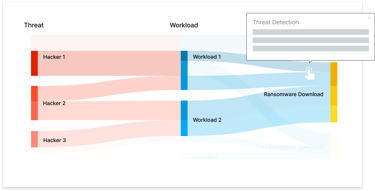
Progressive Disclosure for Speed
Investigation requires both big-picture awareness and precise detail. We layered interaction accordingly.
Hovering reveals immediate context.
Clicking expands into detection lists.
The broader structure remains intact throughout, so analysts never lose orientation.
No page reloads needed. Speed was designed into the interaction model itself.
Overview at first glance, details on demand.

Expose Systemic Vulnerability
Beyond showing incidents, the visualization revealed concentration points and progression patterns across the network. Analysts could identify vulnerability clusters and trace attack flow across workloads.
The experience evolved from responding to isolated alerts to understanding systemic exposure.
Making a shift from reactive alerts to structural awareness.
Impact
From fragmented navigation to an investigative system.
The visualization was demoed at VMware Explore 2022 and 2023, receiving strong feedback from enterprise security teams.
Two rounds of usability sessions with VMware’s internal IT team confirmed the experience felt intuitive and significantly clearer than the previous workflow. Analysts were able to comprehend attack chains faster and with fewer navigation steps.
The project established relational visualization as a core differentiator within NDR.


Feedback from Internal User Interviews
"Exactly what we needed! I can see this visualization would be helpful to our day-to-day job."
- VMware Internal SOC Team
"Easy and clear to understand. The colors definitely help us identify the critical threats effectively."
- VMware Internal SOC Team
Personal Reflection
Designing for high-pressure systems
This project reinforced that security tools are cognitive systems. When stakes are high, visual structure becomes strategic infrastructure.
Designing for this space required systems thinking: aligning product architecture with user mental models, and ensuring that interaction decisions directly supported speed.
If I were to pursue this further, I would explore predictive clustering, AI-assisted anomaly explanation, and cross-session investigation memory.
But the core lesson remains: when clarity improves, responses improve.
View the Design Case Study
The NDR Campaign Visualization project was selected from over 50 projects within the VMware Global Design team to be showcased on the VMware Design official site. Check out the case study I created below.


janjanesther@gmail.com
© 2026 Esther Jan. All rights reserved.